Travel Demands Altering Competitive Edges in Soccer and Basketball Arenas
Written by Olivia Lange · Aug 18, 2026
Travel Demands Altering Competitive Edges in Soccer and Basketball Arenas
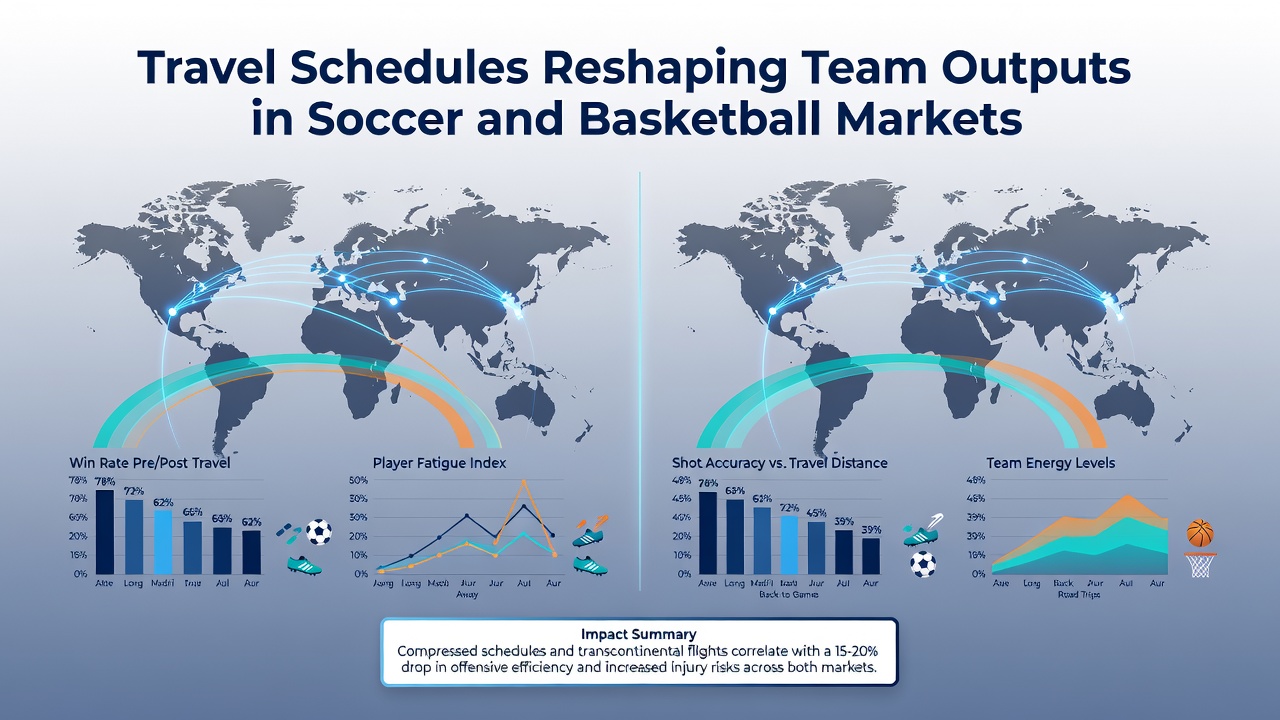
Travel schedules have become a measurable factor in how teams perform across soccer and basketball leagues, with data tracking distances, time zone shifts, and recovery windows that directly influence win rates and point differentials. League organizers compile these metrics season after season, revealing patterns where extended journeys correlate with reduced output in both sports.
Distance Metrics and Performance Indicators
Researchers tracking European soccer clubs during continental competitions note that teams covering more than 1,500 kilometers in a single week show average drops of 0.4 goals scored per match, while defensive errors rise by roughly 12 percent according to aggregated match reports. Similar patterns appear in North American basketball, where NBA squads traveling across multiple time zones record field goal percentages that decline by 3 to 5 points compared to home stands.
August 2026 schedules already list several cross-continental friendlies and pre-season tournaments, giving analysts fresh datasets to compare against prior years when recovery protocols were less standardized. Those who monitor player tracking systems observe that sleep disruption from red-eye flights extends into the second and third matches following arrival, creating measurable dips in sprint frequency and defensive rotations.
Time Zone Adjustments in League Play
Basketball conferences spanning multiple zones provide clear case studies, with teams returning from Pacific to Eastern divisions posting lower three-point volumes in the immediate follow-up games. Soccer federations in South America report parallel outcomes during Copa Libertadores ties, where altitude combined with travel distance amplifies fatigue markers recorded by wearable devices.
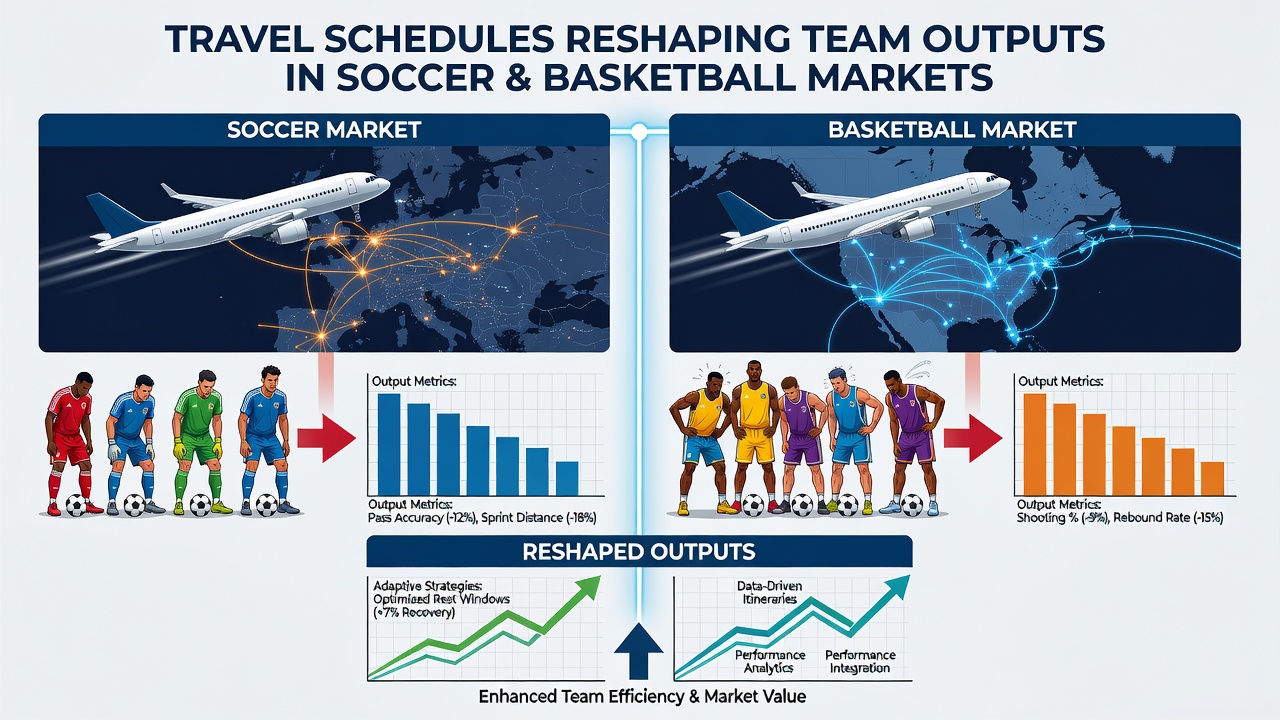
Studies published through academic channels such as those indexed on PubMed quantify how circadian misalignment affects reaction times, with basketball players experiencing 8 to 10 percent slower decision-making windows during evening tip-offs after eastward flights. Soccer data mirrors these findings, particularly in leagues where midweek European fixtures force rapid returns before domestic rounds resume.
Recovery Protocols and Schedule Design
League offices have introduced mandatory rest periods in response to compiled travel logs, yet gaps remain when international breaks overlap with club calendars. Teams that implement structured sleep protocols and adjusted training loads demonstrate smaller performance variances, while those relying on standard itineraries continue to register higher injury incidence rates during congested periods.
Figures released by international sports bodies, including the International Basketball Federation, highlight how back-to-back away games in different countries produce cumulative effects on shooting efficiency and turnovers. Soccer governing entities track comparable statistics, noting that clubs with optimized charter flight arrangements maintain steadier goal differentials across extended away stretches.
Market Implications for Performance Data
Betting markets incorporate travel-adjusted models that factor in historical outputs following long-haul trips, producing line movements that reflect these documented trends. Soccer accumulators and basketball player props both adjust when schedules show clusters of road games, with oddsmakers referencing league-wide datasets rather than isolated results.
Analysts compiling August 2026 previews already flag several high-profile fixtures where travel loads exceed seasonal averages, prompting closer examination of squad rotation patterns released by club medical staffs. These adjustments influence how performance forecasts evolve as new data arrives each week.
Conclusion
Travel schedules continue to shape measurable outputs in both soccer and basketball, with accumulating datasets guiding adjustments in training, recovery, and fixture planning. Observers tracking these variables across multiple seasons note consistent correlations between distance, time zone exposure, and on-field metrics, underscoring the role of logistics in competitive outcomes.